President Trump has lifted stock markets to new highs. Astonishingly, in hedge fund style he has also managed to pulverize stock market volatility. The Donald has made markets great again.
Volatility is the most commonly used metric for investment risk that measures market fluctuation. The Chicago Board of Options (CBOE) even publishes the VIX-index, which captures stock market volatility as measured by the S&P 500 option market. The VIX-index has been dubbed the fear gauge by the media.
However volatility is not the only measure of risk. It measures variation. It does not for instance measure crash risk, where stock markets fall in excess of 20 %.To look at crash risk we have to look at statistical measures of fat tailedness in the return distribution.
The investment community hungered for said measures of crash risk following the ravages of the financial crisis of 2007-2008. In 2011 the good folks at CBOE indulged us by introducing the SKEW-index. Like the VIX-index, it is an option market based measure of risk. The Skew-index measures the fatness of the return distribution.
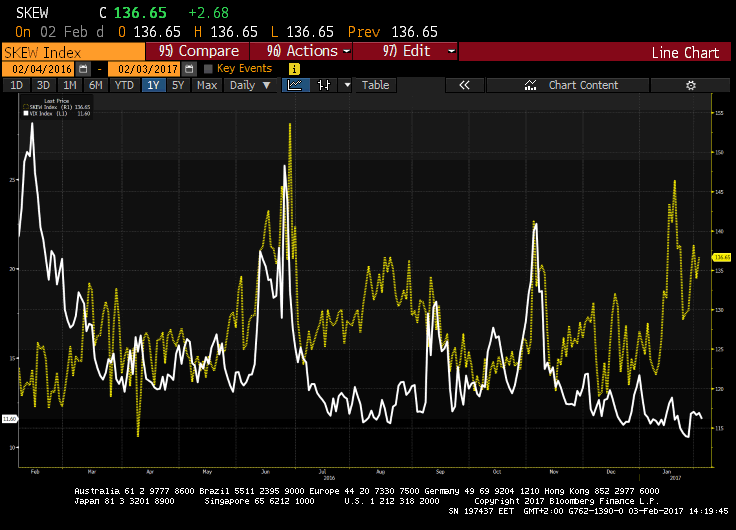
The chart below depicts both the VIX–index (white) and the Skew-index (yellow). Trump has indeed driven volatility to extinction. However, note the elevation in the Skew-index. For perspective, the option market has historically placed the probability of a 20% fall in the S&P 500 between 3.5-5%. At present the Skew index places that probability at roughly 12%. The implication is that options that protect investors from steep stock market falls are relatively expensive.
Hence, markets are not carefree about Trump’s twitter tantrums and assorted apocalyptic innuendoes.
Alas, matters are not as straightforward as presented since there is also a technical explanation for the low level of volatility and high level of skew. Investors have been fond of systematically selling volatility in an era of buy the dip. Some of these strategies may involve selling volatility futures whilst cutting potential downside by purchasing deep out of the money put options.

Chart: CBOE VIX-index in white and the Skew-index in yellow


